Counting Cars

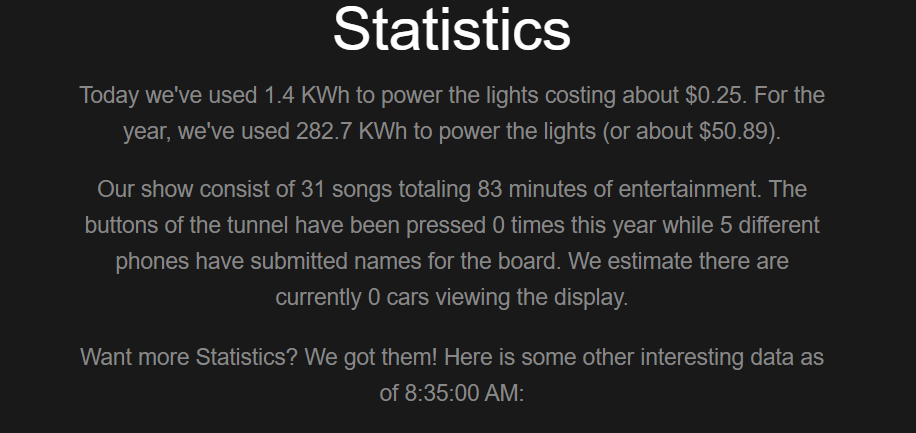
In 2026, we added a car counter to the display. We had always been curious about how many people were actually watching and what the traffic patterns looked like across a night and across the season. Just as importantly, we wanted to give people planning a visit some idea of how busy we are before they get in the car. The live count is shown on our home page and Plan Your Visit page so visitors can check traffic before driving over, and a summary is on vote-now.org along with the other show stats.
How it Works
Two security cameras watch different sections of the street in front of the house. Each camera has its own instance of the car counter, running as a separate pod in our home k3s cluster.
- Each pod reads the camera’s video stream over RTSPS and processes about one frame per second. The rest of the frames are read and thrown away so the stream never falls behind.
- Each frame goes through YOLOv8, an AI object detection model that finds cars, trucks, and buses in the image. We use the extra-large version of the model because the smaller ones weren’t reliable enough at night. It all runs on regular CPUs, so no GPU is needed.
- After dark, frames are brightened and sharpened before detection. Dark color frames and black-and-white infrared frames each get their own contrast boost (CLAHE). The counter checks each frame’s brightness, so there is no time-of-day schedule to maintain.
- When the count changes, the pod publishes an MQTT message with the camera name and the new count, and sends a heartbeat every few seconds even when nothing changes. If the camera stream drops, it publishes a “disconnected” status so a missing camera never looks like an empty street.
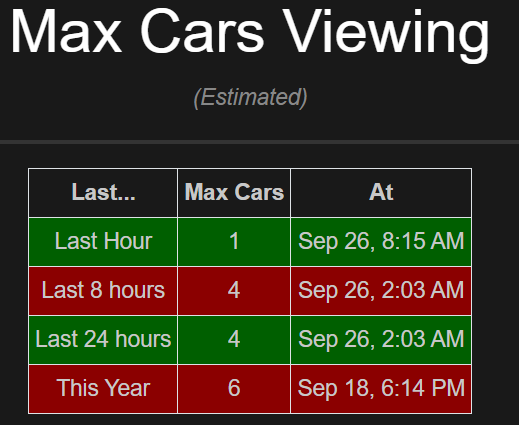
- The vote-now.org server listens for these messages and adds up the cameras to get the live total shown there and on this website. At the same time, the ChristmasStats server records every count in its database along with the votes, names, and songs it already tracks. The vote-now.org statistics page uses that history to show the most cars seen in the last hour, 8 hours, 24 hours, and so far this year.
- For deeper analysis, the full history is available in Grafana. There we can compare nights, see how quickly traffic builds after the show starts, and see what the weather does to attendance.
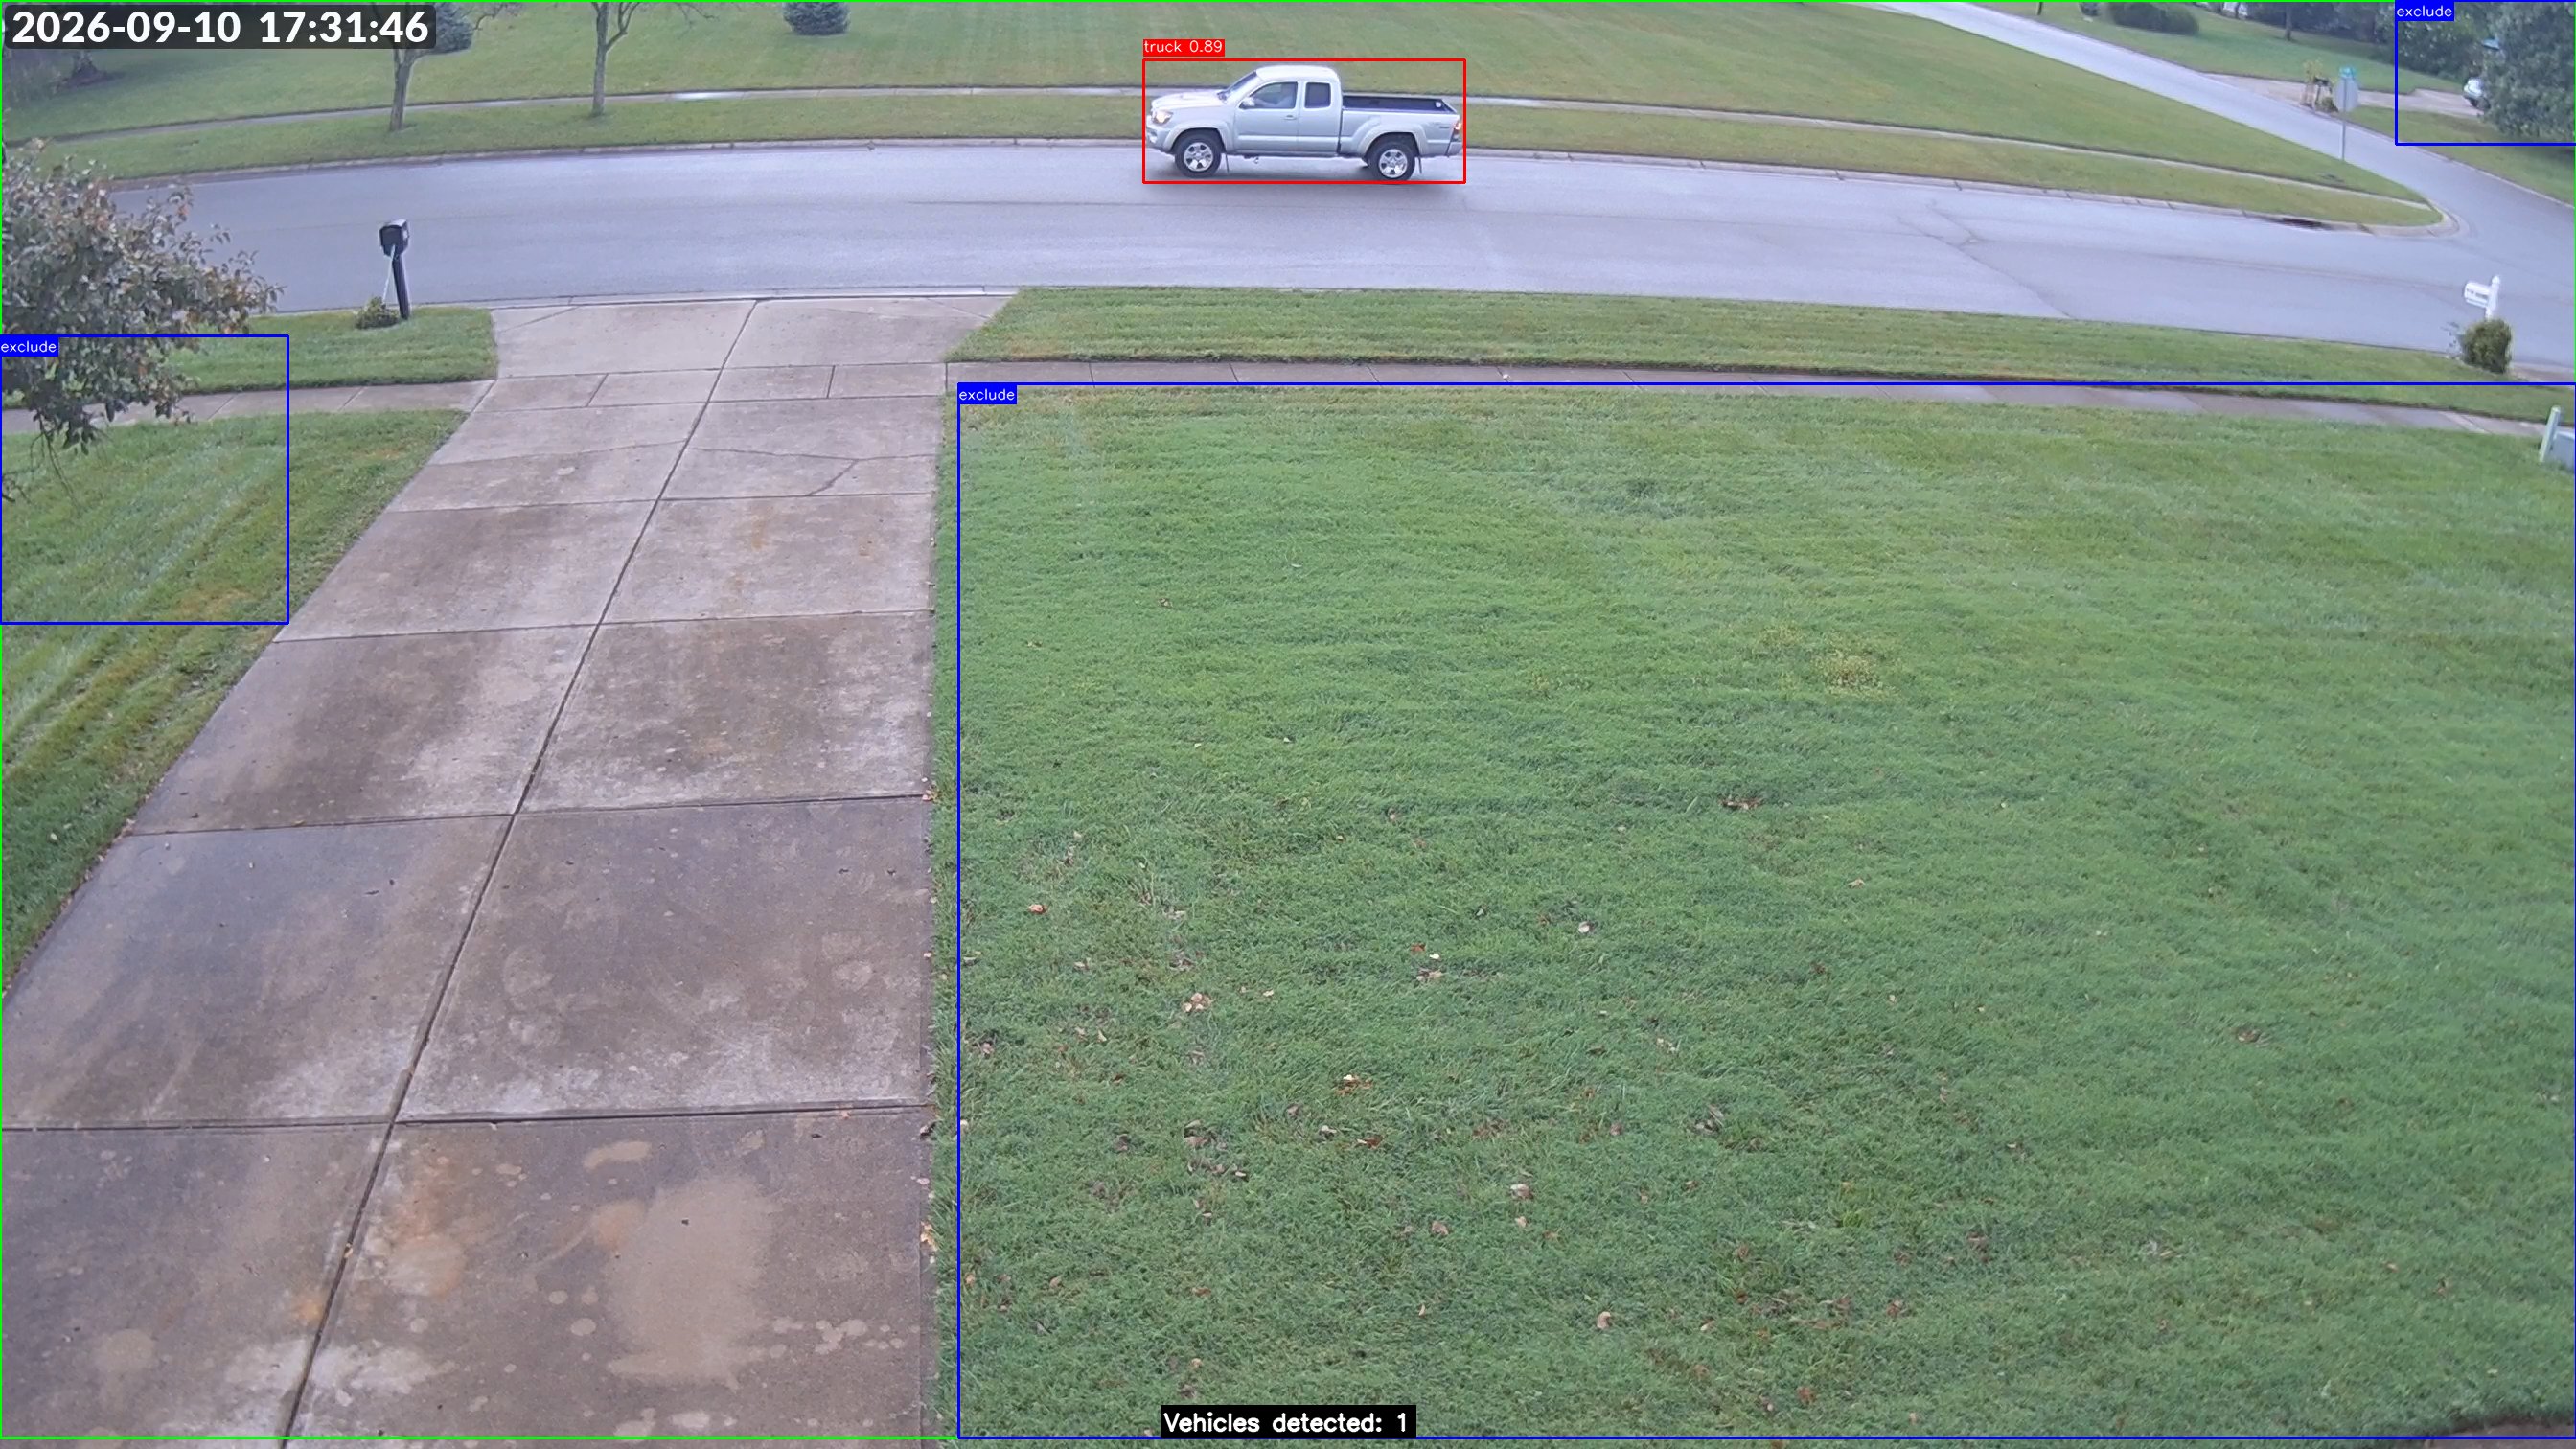
Every time the count changes, the counter also saves an annotated screenshot (like the one here) to shared storage in the cluster. A small image viewer lets us browse them by camera and date to check what the counter actually saw.
Dealing with False Positives
Object detection isn’t perfect. A counter that just counted every car it saw would have been wrong in several ways:
- Passing traffic. A car driving down the street is still a car, but it isn’t watching the show. To fix this, a vehicle only counts once it has stayed in the same spot for a few seconds. The counter matches each car’s detection box from one frame to the next by how much the boxes overlap. If a car moves, its timer starts over.
- Things that aren’t cars. Parts of the frame, like the lawn, trees, and the edge of a neighbor’s yard, sometimes produce phantom detections, especially at night. Each camera has “exclude” regions (the blue boxes in the photo). A detection that falls almost entirely inside one of them is ignored.
- Night and infrared. Detection confidence drops a lot in the dark. We use a lower confidence threshold than normal and brighten frames before detection to make up for it. This lets through some of the false positives described above, and the stationary check and exclude regions catch most of them.
It still isn’t perfect, so treat the numbers as a good estimate rather than an exact count. It is accurate enough to show when the street is quiet and when it’s packed.
Running in Kubernetes
The counter is built to run as a well-behaved Kubernetes service:
- Each camera’s settings (stream URL, scan and exclude regions, thresholds) are in its own ConfigMap. MQTT credentials are in a shared Secret.
- Liveness and readiness probes restart a pod automatically if it stops processing frames.
- On shutdown, the pod sends any MQTT messages still waiting and publishes a final “shutdown” status.
- Prometheus metrics track processing time per frame, stream and MQTT connection health, and reconnects, so we know right away if a camera goes offline.
Source Code
Photos
Seasons featuring this
Years where Counting Cars shows up in the display write-up.